Research
In 2025, more than 85% of large-cap tokens underperformed Bitcoin. In 2026, roughly one quarter of them outperformed Bitcoin. The strongest common feature among those tokens is the value they distribute to tokenholders.
- Fundamentals Index, 2026 through Q3, net of costs
- +82%
- Bitcoin over the same period
- −5%
- Protocols distributing value to tokenholders, Q3 2026
- 267
Across 60 factors on tokens with market capitalizations above $100 million from 2021 through Q3 2026, measures of tokenholder distributions showed one of the strongest associations with subsequent relative returns. An illustrative index backtest selecting tokens with tokenholder yields of at least 1% returned a hypothetical 82% (net of assumed trading costs) through Q3 2026, compared with -5% for Bitcoin. However, the majority of outperformance happened since August, and the same methodology underperformed Bitcoin in prior years.
Measuring Value Distributed to Tokenholders
Over 2000 protocols earn onchain fees from users in 2026 (Q3 YtD). Adding other onchain income (e.g., stablecoin reserve income) yielded ~$40B in traceable onchain income for protocols in that period¹⁾. Some tokenized protocols return a portion of this value to tokenholders, most prominently through buyback-and-burn, the equivalent of a share repurchase - over 250 protocols did so this year. Others pay token rewards - all of those payouts in aggregate are referred to as Holder Revenue.
To assess the actual value distributed, we net out dilution: If rewards are paid through newly minted tokens, the supply expansion offsets the gain, and the net value distributed is zero. Rewards funded by newly issued tokens redistribute value from non-recipients to recipients rather than creating net value for tokenholders as a group:
Value distributed to tokenholders = Holder revenue minus dilutive emissions
Dividing this annualized figure by market cap gives a crypto version of dividend yield²⁾. Both the number of protocols distributing and the value distributed to tokenholders have trended upward in recent years, though the latter retraced in line with market prices in 2026.
Value distributed to token holders provides the strongest signal for outperformance
Bitcoin has been hard to beat as a benchmark in the Blockchain token universe since the end of the 2021 bull market, as analyzed multiple times, most recently by Messari/Blockworks. In 2025, the median $100M+ market cap token fell 80% vs. Bitcoin³⁾.
There are, of course, episodes of rotation into themes like DePIN, AI, or Memecoins, though none of them outperformed Bitcoin for more than two consecutive quarters. As the Bull Market ended in Q4 2025, the question is whether this opens room for themes that can sustain longer outperformance vs. the leading asset in crypto.
We regularly analyze the onchain fundamentals (1kx Revenue Dashboard). Given the positive trends in revenues and related metrics in recent years, we checked whether those fundamentals are associated with subsequent returns.
Factors based on the value distributed to tokenholders and its ratio to market cap (dividend yield) generated the strongest signal for outperformance vs. other tokens since 2021; furthermore, those tokens started to outperform Bitcoin in 2026.
More concretely: The value distributed to tokenholders and the dividend yield both lead the ranking of significant regression coefficients, both on a monthly and quarterly basis⁴⁾⁵⁾
This means, for example, tokens with a dividend yield of 1+% at the beginning of the quarter:
Went on to beat the rest of the $100M+ market-cap token universe by about 7pp in relative performance to Bitcoin after controlling for size, momentum, volatility, and beta⁶⁾
Generated an outperformance of about 30pp vs. Bitcoin and about 50pp vs. the tokens with less or no dividend yield⁷⁾ since 2025 when market-cap-weighting them
Had a median quarterly performance vs. Bitcoin of +17% in 2026
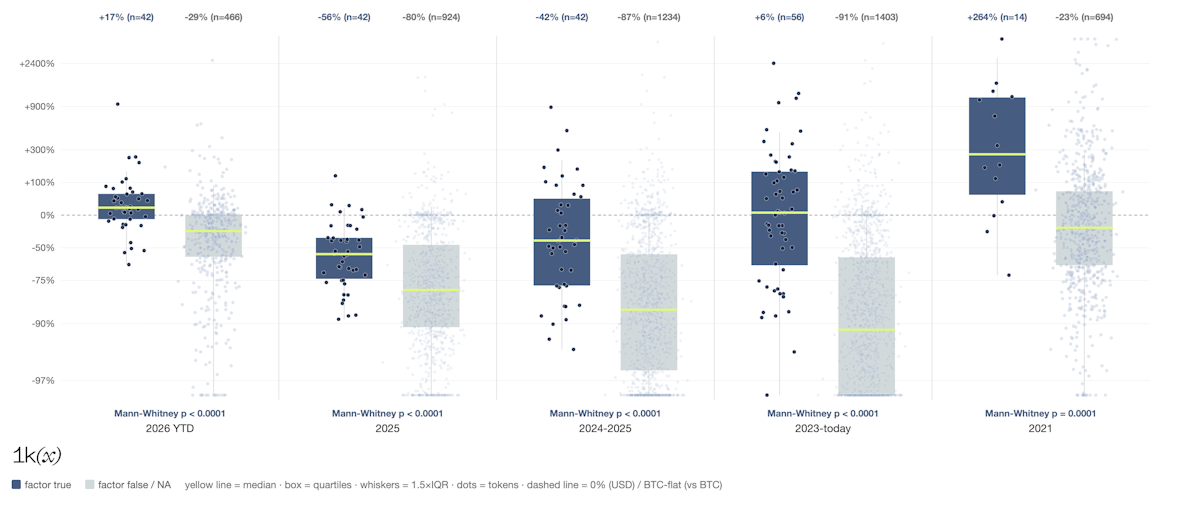
Sample sizes remain limited. The appendix details the caveats, full range of factors, and additional findings.
Overall, this points in the same direction as the work of Babeyev and Aliyev, who used a Portfolio-Sort approach as well and found that fundamentals-based factors carry statistically significant risk premia.
There is an interesting parallel to stock markets: Stocks in the S&P 500 and Nasdaq 100 yielding 3%+ in dividends started to show significantly higher returns in 2026 - which they didn’t in the previous years:
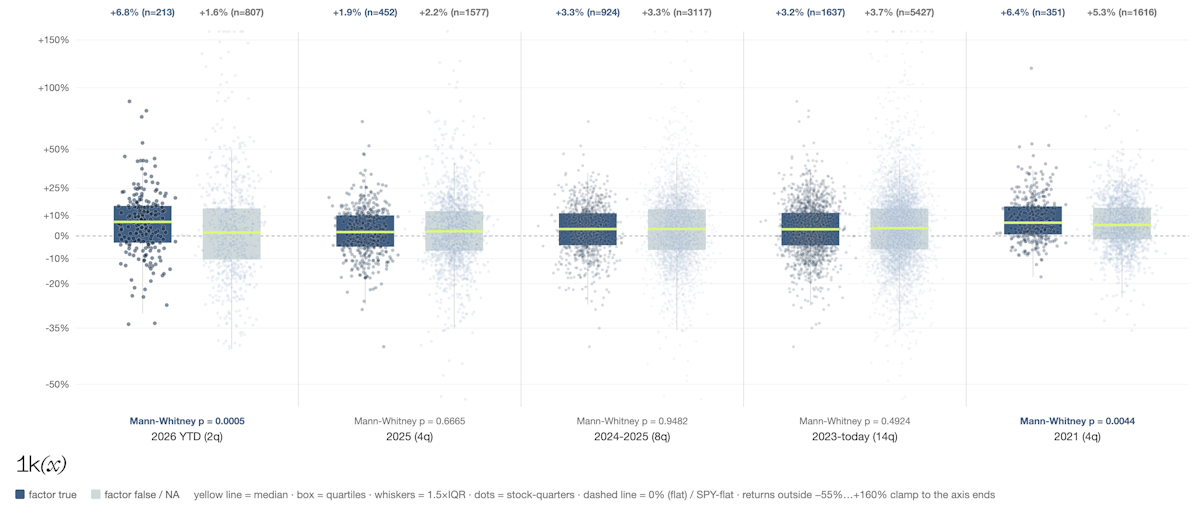
Illustrative Index as a Backtest
Based on the above findings, one can create the following index strategy:
Monthly rebalanced
$100M+ market cap
Dividend yield 1%+ in the prior quarter
Weigh the resulting token universe by their value distributed to tokenholders
20% individual cap
Such a “Fundamentals Index” generated over 80% ($ based) in 2026 whilst Bitcoin was down 5%. However, the majority of outperformance happened since August, and - just like most of the market - the same methodology underperformed Bitcoin in prior years.
The latest constituents (per October 2026 rebalance) with 1+% weight are Hyperliquid, Pump, BNB, Uniswap, Raydium, Aerodrome, Lido, PancakeSwap, Jupiter, Lighter, Pons, Stonk, Curve. As the statistical analysis suggests, an unweighted version outperformed Bitcoin this year as well.
We also explored other index strategies, picking factors like revenue yield, fee growth, or market cap for universe selection and weighting. Yet - in line with the statistical findings - the dividend yield-based strategy resulted in the highest returns over the period tested.
Why distributions are not appropriate for every protocol
As in traditional markets, sustainable distributions generally require profits or surplus cash flow. Many protocols are still in their growth phase: There are 870 protocols on track for $100k+ gross profit in 2026 (data on actual protocol profits are yet impossible to gather at scale). Only 280 of them achieve 1%+ gross-profit yield⁸⁾.
Moreover, tokens can serve many purposes, so picking just one aspect the market favors right now isn’t the right way to design a token that matches the protocol’s strategy.
Take for example token burn as a factor from our analysis. After excluding protocols with distribution yields above 0.5%, we find no statistically significant association between token burns and relative returns. So instead of burning it, many protocols might be better advised to put that capital to work, scale, and build the foundation for eventual profits that enable dividend distribution.
Conclusion
Value distributed to token holders measures the dollar value holders receive after deducting dilutive emissions. What we call Dividend yield (or tokenholder yield) expresses this value relative to a token’s market capitalization.
Across 60 factors on tokens with market capitalizations above $100 million from 2021 through Q3 2026, measures of tokenholder distributions showed one of the strongest associations with subsequent relative returns. Given the limited history and the number of factors tested, these findings can be viewed as a return signal rather than evidence of causation.
An illustrative index backtest selecting tokens with tokenholder yields of at least 1% returned a hypothetical 82% (net of assumed trading costs) through Q3 2026, compared with -5% for Bitcoin. However, the majority of outperformance happened since August, and the same methodology underperformed Bitcoin in prior years. The strategy, and other factor-based token sets, had not achieved similarly sustained outperformance in prior years; as of now, 2026 is the year Fundamentals beat Bitcoin.
Appendix A: Methodology and Caveats
Factors, time range, and token universe
We structured 60 factors around 3 Blocks:
Fundamentals: Fees, Fee growth, Revenue, Value distributed to tokenholders, and Dividend yield
Token Mechanics and Characteristics: Burn Mechanism, Listings on major Exchanges, Part of Blockworks Transparency Framework, MarketCap
Sectors/Narratives: Larger sectors (Blockchains, DeFi) or smaller narratives (L2s, Memes, AI)
Many fundamental factors are continuous, whilst most factors of 2) and 3) are binary.
We then tested whether factors predict token returns on i) a monthly and ii) a quarterly basis. For each month/quarter, we checked the data per month-end of the previous time interval:
Market cap of at least $100M
No stablecoin/wrapped/liquid-staking-token/tokenized-asset
Price data no more than 7 days old
Return for the following month/quarter is then measured in USD- and Bitcoin-terms. This was done over 23 quarters (2021-2026 Q3), such that the overall universe includes 1,149 distinct tokens (6,848 token-quarters).
Evaluations
We applied two statistical methods and used the boxplots for visual inspection (using the Mann-Whitney Test to get a sense of the significance of the different Medians)
Portfolio-Sorts: Applied to equal- and market-cap-weighted portfolios to detect size-driven effects.
Fama-MacBeth (FMB) Regression: added a run with controls on log market cap, 6-month momentum, 12-month volatility, and 12-month beta to Bitcoin. Minimum 20 tokens / 6 per factor bucket. Included pooled panel regression as well (with errors clustered by token)
The time-series values (spread for 1) and coefficients (for 2) are both tested with Newey-West.
Caveats: data availability, overlap, and survivorship
The sample is short (23 quarters / 69 monthly observations), but quarterly and monthly results corroborate each other
Fee coverage only picked up meaningfully after 2022 (same for other PnL items) - we ran the same analysis for data since 2023 with the same results for the main finding, though some variations in significance, e.g. the factor 1B+ market cap was significant 2023+ whilst not in the overall timeline, same with the factor “Is DeFi protocol”.
Not all static labels (e.g. exchange listing, Blockworks token transparency framework) are available through the full time series, and sometimes have too little history for the tests; hence, they only offer some indication via the distribution visualizations.
Factors inherently overlap (e.g., tokens that distribute large “dividends” to tokenholders need to earn decent fees and revenues), which is reflected when inspecting buckets; nevertheless, it also shows which subsets of larger factor groups outperform.
The prices from CoinGecko, whilst snapshotted over the past year, carry some survivorship (tokens removed over time cannot enter past universes)
Caveats: look-ahead controls
All factor values use only information dated as of the end of the previous month: flow factors (e.g., fees, revenue, holder revenue) are the trailing three complete months from the fee panel, annualized, and yield factors divide that run rate by the previous month’s market cap.
One exception is the factor “Major CEX listing within the time period” by design.
Hence, Index/portfolio construction uses only data available at the preceding month- or quarter-end
Caveats: multiple-hypothesis testing
The per-period regressions absorb cross-sectional correlation, and Newey-West the autocorrelation
The t-statistics should still be read conservatively: with 60 factors tested, a few strong results are expected by chance alone.
The Value-weighted buckets should also be interpreted cautiously, given the total universe of a few hundred tokens with the known Pareto distribution of token valuations.
Whilst non-parametric, the rank transformation applied in the tests is not a linear signal; rather, it shows monotonic association. And of course, none of these provides a causal reading.
Portfolio/Index implementation
Transaction costs incl. Slippage were assumed at 20 bps per trade
Limited to 100 tokens
Require 1% dividend yield (annualized based on the previous 3 months) in the previous period (month/quarter)
Cap individual weights at 20%
Monthly or quarterly rebalancing
Appendix B: Further Findings
Below lists additional findings (on 100M+ mcap tokens) across the three factor blocks:
Fundamentals
Factors around Fees and Revenues outperformed in the Portfolio-Sort. Still, the control in Fama-MacBeth showed this is mainly a size effect: larger market cap tokens performed better, so adding fees/revenues as a factor didn’t add outperformance (since larger fees also correspond with larger market cap).
Fee growth itself also didn’t show any significant signal for outperformance.
Holder Revenue/its yield is a relevant factor for outperformance, though that’s an artifact and vanishes if we exclude protocols paying 1%+ dividend yield.
Paying incentives signals underperformance, only significant though for when high relative to the market cap (see “Incentive yield (emitters only)”; a large amount of that in 2021)
Token Mechanics and Characteristics
Token burns themselves have no significant effect on outperformance when we remove protocols that pay 0.5%+ dividend yield.
Market cap $1B+ was a significant factor since 2023 (which is why we in general controlled for size) - it had an enormous drag in Q1 2021 for the Portfolio-Sort, though.
Getting a major CEX listing in the previous quarter signaled underperformance.
Tokens under the Blockworks Transparency Framework signal outperformance under Fama-MacBeth, but data just covers five quarters and 22 tokens in our universe (half of which also have dividend yields >0.5%). It seems to be a factor worth tracking, though.
Sectors/narratives
Alt L1S had long streaks of outperformance for the Portfolio-Sort, but not significantly on FMB
Layer 2 tokens showed harsh underperformance in the boxplots, though the two statistical evaluations didn’t confirm that
Governance tokens signaled underperformance for FMB since 2023, driven by large drawdowns in 4 separate quarters
DePIN tokens, though not significant over the full timeline, had strong outperformance in 2023 and early 2024, with strength in Q1 2026 as well
Footnotes
- 1See 1kx Revenue Report.↩
- 2This is of course an analytical analogue to the TradFi definition as there is no legal claim on these for tokens. One can also call it “Tokenholder Yield” if it sparks confusion.↩
- 3Based on CoinGecko Market Cap data.↩
- 4Some factors not shown if less than 6 quarters of data available.↩
- 5While the chart shows p-values of 0.1 as threshold, those factors related to value distributed to tokenholders have p-values below 0.05.↩
- 6This is the interpretation of 7% value for the Factor “Dividend Yield of 1%+” in the chart above.↩
- 7In other words: 50pp is the cumulative quarterly spreads between tokens that have “Dividend Yield of 1%+” and those that don’t based on the PortfolioSort, but with MarketCap weightings.↩
- 8Note that the 870 total includes protocols that have not launched a token, hence the gross-profit yield is not defined.↩
Disclosure
This article is for general information purposes only and should not be construed as or relied upon in any manner as investment, financial, legal, regulatory, tax, accounting, or similar advice. Under no circumstances should any material at the site be used or be construed as an offer soliciting the purchase or sale of any security, future, or other financial product or instrument. Views expressed in posts are those of the individual 1kx personnel quoted therein and are not the views of 1kx and are subject to change. The posts are not directed to any investors or potential investors, and do not constitute an offer to sell or a solicitation of an offer to buy any securities, and may not be used or relied upon in evaluating the merits of any investment. All information contained herein should be independently verified and confirmed. 1kx does not accept any liability for any loss or damage whatsoever caused in reliance upon such information. Certain information has been obtained from third-party sources. While taken from sources believed to be reliable, 1kx has not independently verified such information and makes no representations about the enduring accuracy or completeness of any information provided or its appropriateness for a given situation. 1kx may hold positions in certain projects or assets discussed in this article.